9. Performance
9.1. Specs of tested server
- Brand: Dell PowerEdge R320
- CPU: Intel Xeon E5-1410 v2 @ 2.80 GHz
- Memory: 8 GiB DIMM DDR3 Synchronous 1600 MHz
- Number of cores: 8
9.2. Load test setup
9.2.1. websocket-tester
A custom websocket-tester is developed to simulate queries to the server. Multiple request are send using a simple loop. For more information on the exact queries see description on testing scenarios further down this page.
9.2.2. Celery flower
For assessing performance of calculations the library Celery Flower is used. Refer to the official docs for more information.
To setup Flower on a remote server with Django you have to use the proxy server. For safety setup a htpasswd file in the nginx configuration.
See example configuration here for nginx with Celery Flower (adjust to your needs)
example_nginx_flower
For RabbitMQ the management plugin has to be enabled:
$ sudo rabbitmq-plugins enable rabbitmq_management
An example to start flower (make sure you are in the project root):
$ flower -A ramasceneMasterProject –port=5555 -Q modelling,calc_default –broker=amqp://guest:guest@localhost:5672// –broker_api=http://guest:guest@localhost:15672/api/ –url_prefix=flower
In turn you can access flower via the web browser with <domain>/flower/.
9.2.3. Settings for Celery
The following settings are in place:
- [Django settings] CELERY_WORKER_MAX_TASKS_PER_CHILD = 1
- [env. variable] OPENBLAS_NUM_THREADS=2 for default calculations
- [env. variable] OPENBLAS_NUM_THREADS=5 for modelling calculations
- [Celery] –concurrency 1 for default calculations
- [Celery] –concurrency 1 for modelling calculations
Each Celery queue has its own dedicated worker (1 worker for default and 1 worker for modelling)
9.2.4. Testing scenarios and simultaneous requests
The longest calculation route is the one with the selections TreeMap and Consumption view. For simplicity we use “value added” as the indicator coupled with “total” for product and countries. All scenarios use this selection. For modelling we select “totals” for all categories except “consumed by” which contains the “S: Agriculture, hunting and forestry” aggregate. A single technical change is set to an arbitrary value of 100.
- Scenario A [Analytical]: 30 analytical request whereby 17 requests cover all years. and 13 request use the year 2011.
- Scenario B [Modelling]: 30 modelling request whereby 17 requests cover all years. and 13 request use the year 2011. All requests do heavy calculations covering the modelling of intermediates.
- Scenario C [Analytical + Modelling]: 15 requests over 15 different years for analytical and 15 request over 15 different years for modelling.
Idle MEM use at point before load test: 572M
9.2.5. Results scenario A
- Max. time for a given task: 8.3 sec.
- Total time for the last user to finish the task: 4 min. and 58 sec.
- Highest detected MEM load: 2.87G (includes the idle MEM)
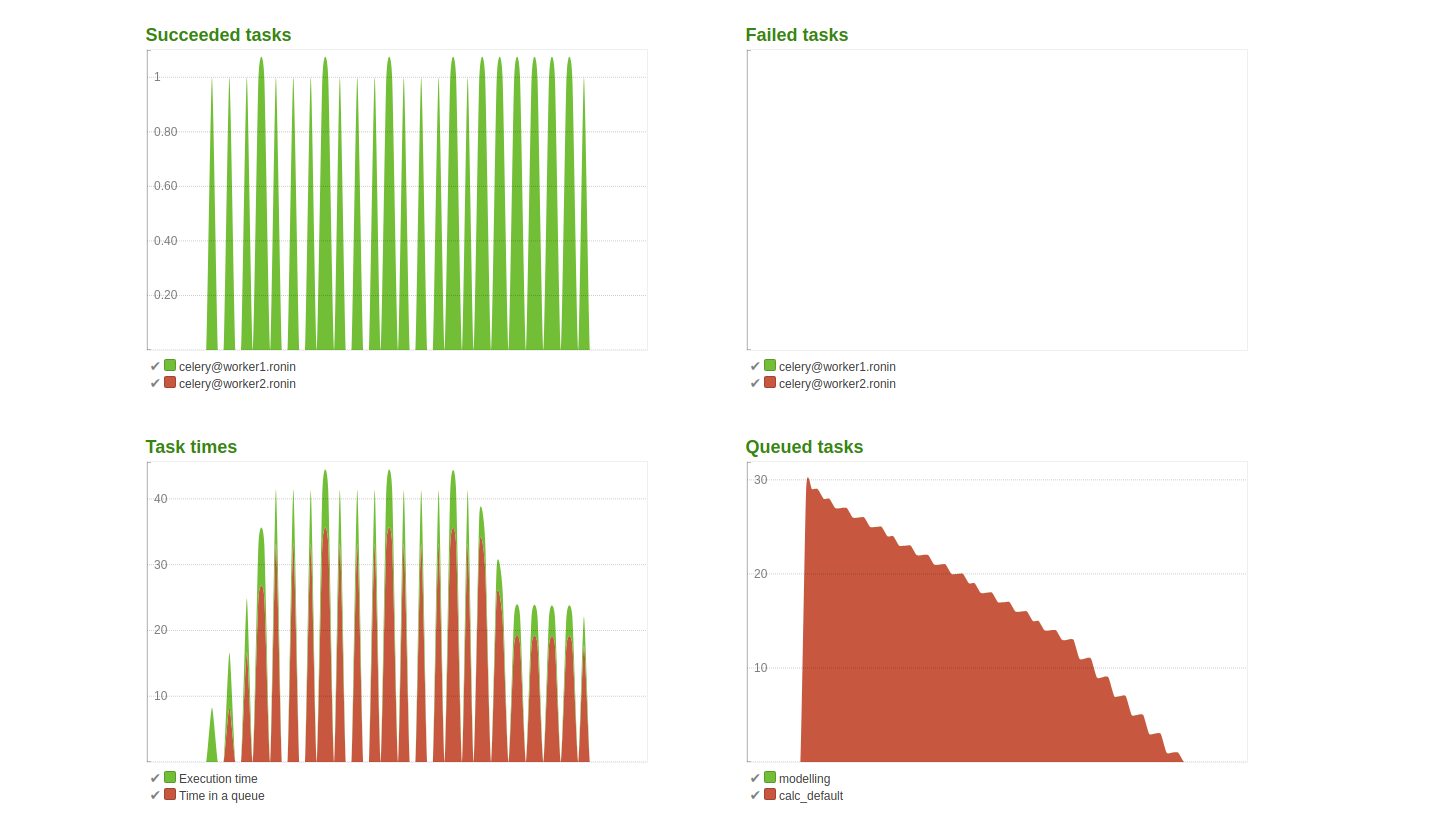
Conclusion:
The queued task in the right bottom plot show expected behaviour due to the concurrency set to 1. The time in queue for a given task is relatively long compared to the time take to do calculations. This was expected as the CPU use is limited coupled with no simultaneous requests.
9.2.6. Results scenario B
- Max. time for a given task: 48.97 sec.
- Total time for the last user to finish the task: 22 min. 59 sec.
- Highest detected MEM load: 3.49G (includes the idle MEM)
- Execution time of the first task: 46.09 sec.
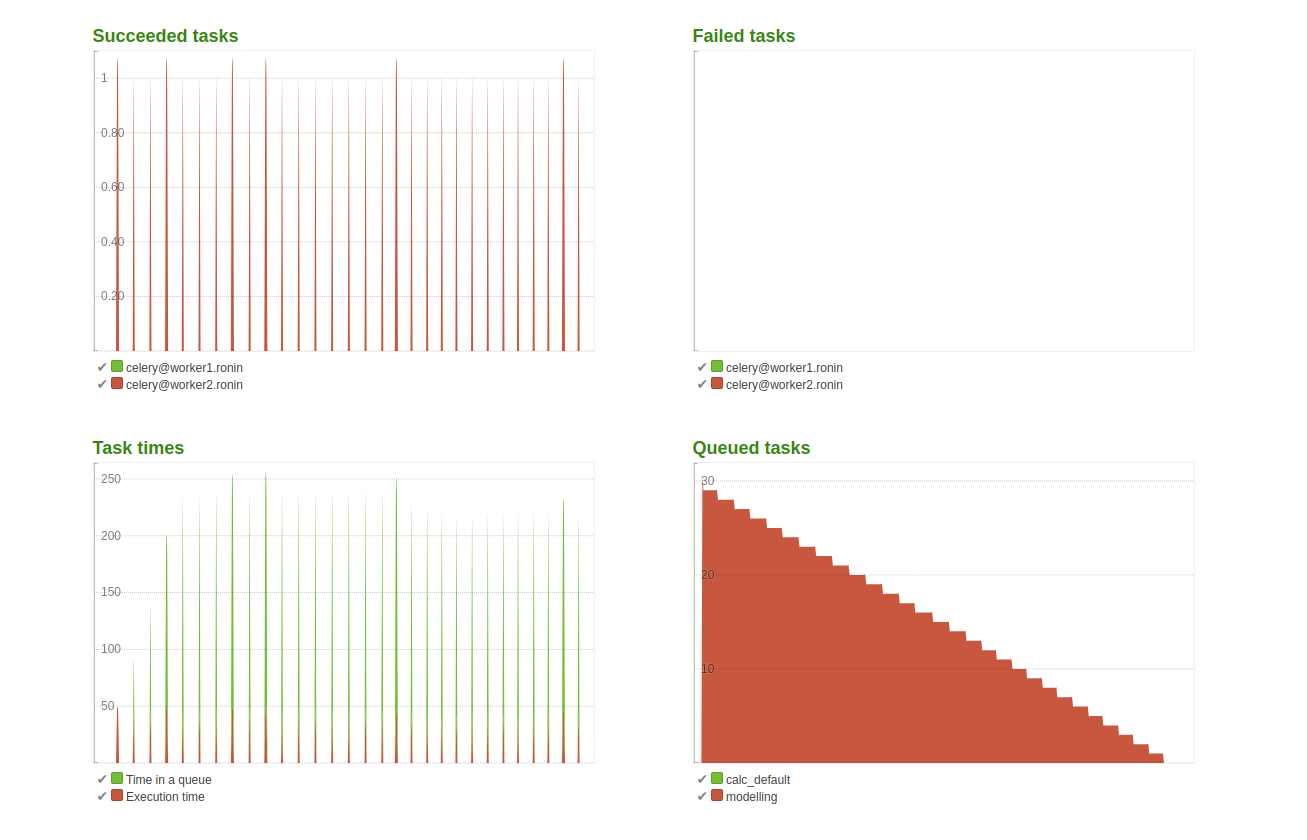
Conclusion:
CPU use is less limited for modelling and it can use 5 cores if needed, however that only speeds up execution time. The last user still has to wait considerable time as opposed to the analytical queries. The spikes in the two plots on the left show that there are no concurrent requests handled as set in the settings.
9.2.7. Results scenario C
- Max. time for a given analytical task: 9.48 sec.
- Total time for the last user to finish the task for analytics: 3 min. 28 sec.
- Max. time for a given modelling task: 49.36 sec.
- Total time for the last user to finish the task for modelling: 11 min. 55 sec.
- Highest detected MEM load: 6.44G (includes the idle MEM)
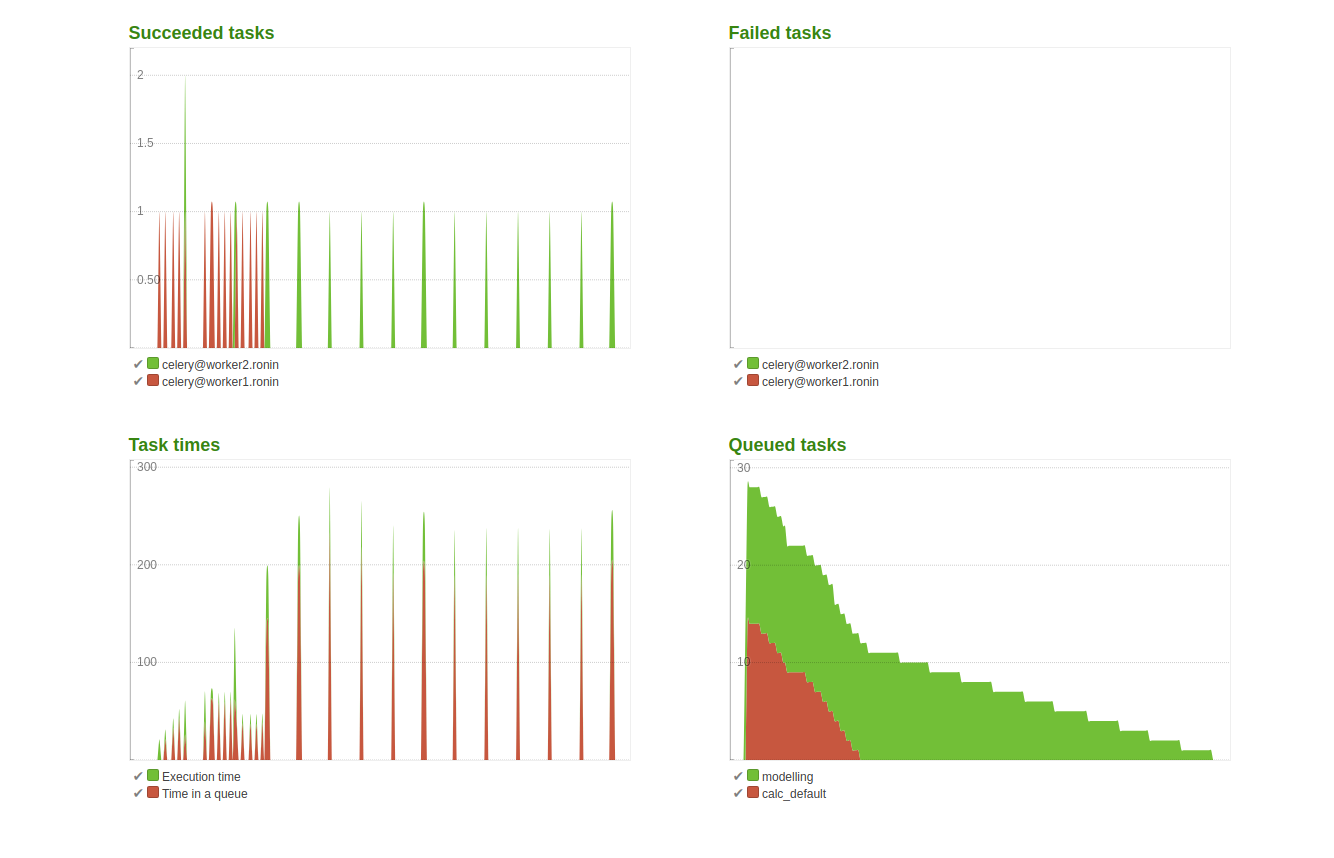
Conclusion:
As shown in the top left and bottom right graph both workers are active. The analytical queue depletes faster than the modelling queue, which is also expected and desired behaviour. The MEM load has increased as both workers use memory.
9.2.8. Final conclusion
Modelling has a significant impact on CPU use, in turn a limit is set on CPU considering the specs of the tested server. This limit results in relatively long waiting time for users doing modelling. To circumvent this either a server with more powerful specs is required or celery can be configured with workers on different machines. In both cases more CPU is required and optimally more memory. If more memory is in place, logically concurrency can be increased however new load tests have to be performed.